Six months, one number that matters
$835,800 billed became $540,871 in net revenue. The audit’s job is to explain the gap — and find what’s recoverable.
| GROSS CHARGES BILLED
$835,800 Jan–Jul, Jul partial |
CASH COLLECTED
$542,246 64.5% blended rate |
NET REVENUE
$540,871 per TN revenue reports |
| SESSIONS BILLED
4,947 66 missed appts |
OUTSTANDING AR
$160,174 as of Jul 20, 2026 |
CLAIMS PAID
71.9% 3,671 of 4,666 |
Headline KPI Comparison by Month |
||||||||
| KPI | Jan | Feb | Mar | Apr | May | Jun | Jul* | H1 Total / Avg |
| Total Gross Charges Billed | $131,932 | $121,992 | $138,743 | $139,262 | $136,899 | $131,277 | $35,696 | $835,800 |
| Self-Pay Charges | $6,380 | $6,934 | $7,915 | $7,820 | $5,864 | $5,255 | $991 | $41,159 |
| Insurance-Billed Charges | $125,552 | $115,059 | $130,828 | $131,442 | $131,035 | $126,022 | $34,705 | $794,642 |
| Total Cash Collected | $75,468 | $87,417 | $93,952 | $89,032 | $101,922 | $72,629 | $21,826 | $542,246 |
| Patient Payments Collected | $14,015 | $32,248 | $21,825 | $22,512 | $16,986 | $19,041 | $6,085 | $132,711 |
| Insurance Payments Collected | $61,453 | $55,169 | $72,128 | $66,520 | $84,936 | $53,588 | $15,741 | $409,535 |
| Net Revenue (TN Report) | $75,468 | $87,417 | $93,952 | $88,531 | $101,072 | $72,604 | $21,826 | $540,871 |
| Collection Rate | 57.2% | 71.7% | 67.7% | 63.9% | 74.5% | 55.3% | 61.1% | 64.5% |
| Total Sessions Billed | 779 | 726 | 842 | 821 | 800 | 770 | 209 | 4,947 |
| Missed Appointments | 13 | 13 | 6 | 13 | 12 | 7 | 2 | 66 |
| Missed Appointment Fees Billed | $990 | $1,010 | $395 | $895 | $690 | $445 | $100 | $4,525 |
| Refunds Issued | $0 | $0 | $0 | $501 | $850 | $25 | $0 | $1,376 |
| Patient Balance Still Owed | $2,779 | $2,555 | $2,497 | $4,147 | $3,805 | $3,506 | $831 | $20,120 |
| Insurance Balance Not Yet Paid | $3,186 | $3,224 | $6,595 | $18,181 | $39,688 | $60,779 | $28,520 | $160,174 |
| Claims Submitted (Insurance) | 737 | 684 | 777 | 768 | 763 | 735 | 202 | 4,666 |
| Claims Paid (Count) | 717 | 665 | 735 | 657 | 517 | 355 | 25 | 3,671 |
| Claims Paid % | 97.3% | 97.2% | 94.6% | 85.5% | 67.8% | 48.3% | 12.4% | 71.9% |
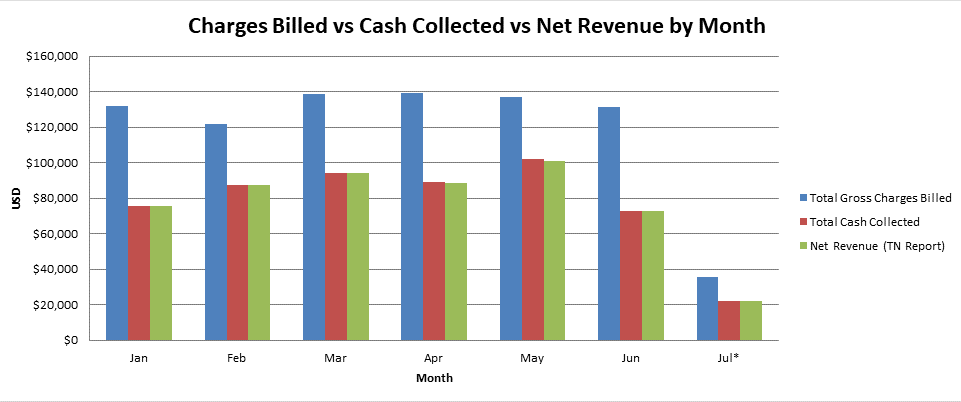
Charges vs. cash, month by month(Trend Charts)


- Gross charges billed held fairly steady at $122K–$139K/month Jan–Jun, then dropped to $36K in the partial July period.
- Cash collected and net revenue track each other almost exactly every month (as expected), running well below charges billed — the gap is widest in Jan ($132K billed vs $75K collected) and narrowest in May ($137K vs $102K).
- May stands out as the strongest collection month in absolute dollars (~$102K collected); Jun and Jul are the weakest before the partial-month drop-off.
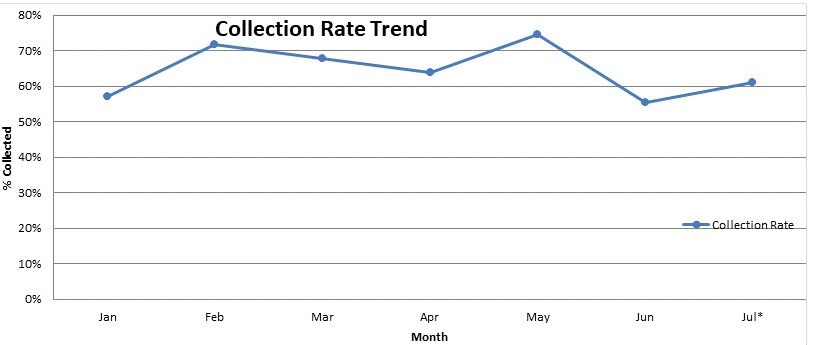
- Collection rate ranged from 55% (Jun) to 75% (May) over Jan–Jul 2026 — no steady up/down trend, just monthly swings.
- Best months: Feb (72%) and May (75%); weakest: Jun (55%), with a partial rebound to 61% in Jul.
- Blended H1 average sits around 64–65%, well below the May peak — signaling room to tighten collections in the softer months.

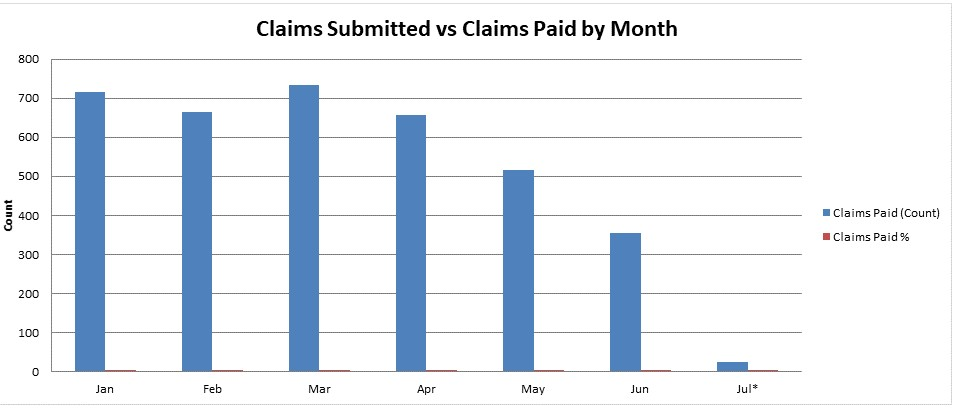
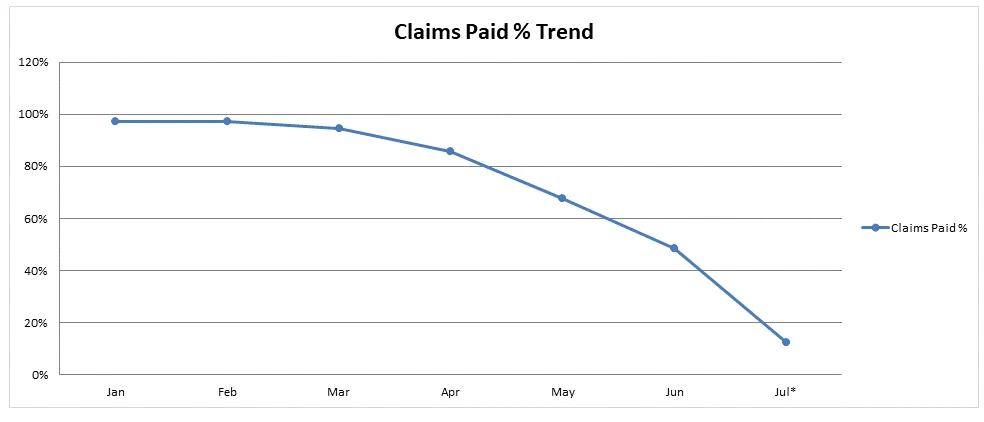
- Claims paid volume fell steadily across H1 — from 717 in Jan down to 355 in Jun, with just 25 in the partial July window.
- The decline from Mar (735) onward is steep: Mar→Jun claims paid dropped by more than half, even though claims submitted stayed fairly consistent each month (~680–780).
- That drop reflects processing lag, not lost revenue — recent months’ claims are still working through payer adjudication (30–90+ days), so the “Claims Paid %” line sitting near zero for Jun/Jul is expected, not a red flag.

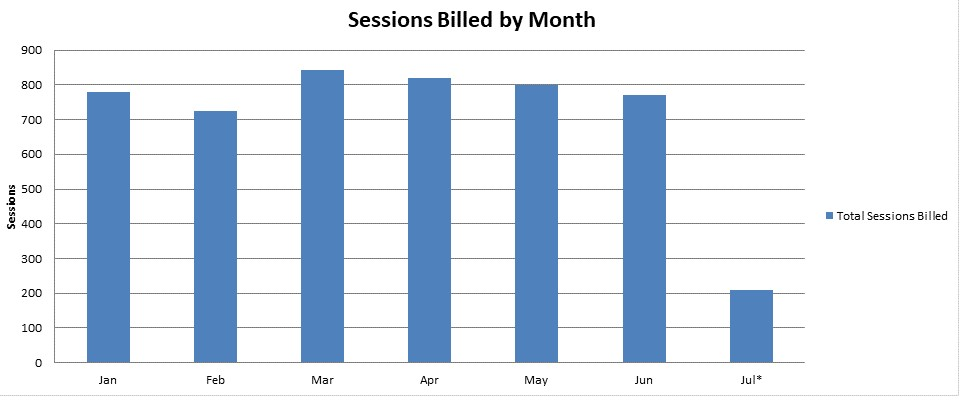
- Sessions billed stayed fairly consistent Jan–Jun, ranging 725 (Feb, the low) to 843 (Mar, the high) — no clear upward or downward trend, just normal month-to-month variation.
- Jul shows only ~210 sessions, but that’s a partial month (10 of 31 days), not a real drop — on a run-rate basis it’s actually in line with the rest of H1.
- Total volume across the full period: 4,947 sessions, averaging roughly 785/month for the six complete months.
Claims Volume & Accounts Receivable Aging |
|||||||
Snapshot of outstanding insurance claims aged as of July , 202x |
|||||||
| Claims Submitted vs Paid by Month | |||||||
| Metric | Jan | Feb | Mar | Apr | May | Jun | Jul* |
| Claims Submitted (Insurance) | 737 | 684 | 777 | 768 | 763 | 735 | 202 |
| Claims Paid (Count) | 717 | 665 | 735 | 657 | 517 | 355 | 25 |
| Claims Outstanding (Count) | 20 | 19 | 42 | 111 | 246 | 380 | 177 |
| Claims Paid % | 97.3% | 97.2% | 94.6% | 85.5% | 67.8% | 48.3% | 12.4% |

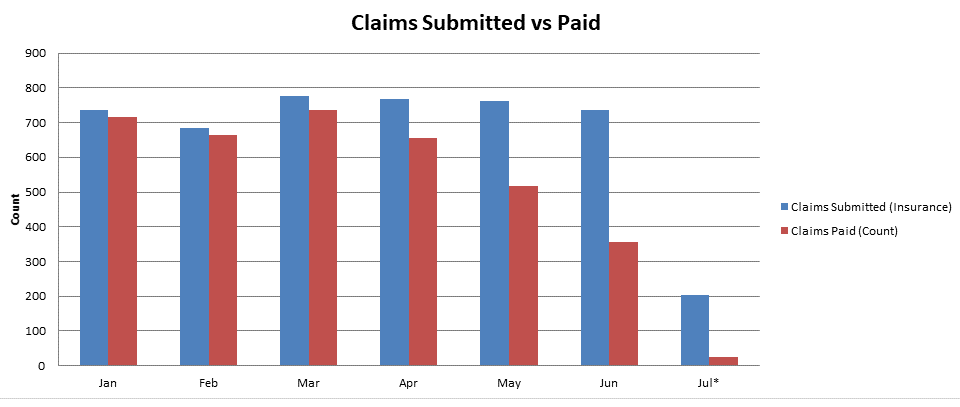
- Claims submitted stayed fairly steady all H1 (~685–780/month), so the gap vs. claims paid is a payment-timing issue, not a submission problem.
- The paid bar falls further behind submitted each month from March onward — Jan/Feb are nearly caught up, but by Jun only ~48% of that month’s submitted claims have paid.
- Jul shows both bars low simply because it’s a partial month (10 days) — not a real submission or payment drop.

- Claims paid % holds strong through Q1 (97% Jan/Feb, 95% Mar), then declines steadily each month after — 86% Apr, 68% May, 49% Jun, 12% Jul.
- The drop-off isn’t a collections failure — it’s claims-processing lag: recent months’ claims simply haven’t had the typical 30–90+ days to adjudicate yet.
- Read Jan–Mar as the true benchmark (~94–97% eventual paid rate); expect Apr–Jul to climb toward that same range as those claims age.
Accounts Receivable Aging — Outstanding Insurance Claims (as of Jul, 202x) |
||||
| Aging Bucket | Count | Amount Outstanding | % of Total AR | |
| 0-30 | 321 | $52,889 | 33.0% | |
| 31-60 | 313 | $49,900 | 31.2% | |
| 61-90 | 207 | $34,179 | 21.3% | |
| 91-120 | 80 | $13,185 | 8.2% | |
| 120+ | 62 | $10,020 | 6.3% | |
| Total Outstanding AR | 983 | $160,174 | ||

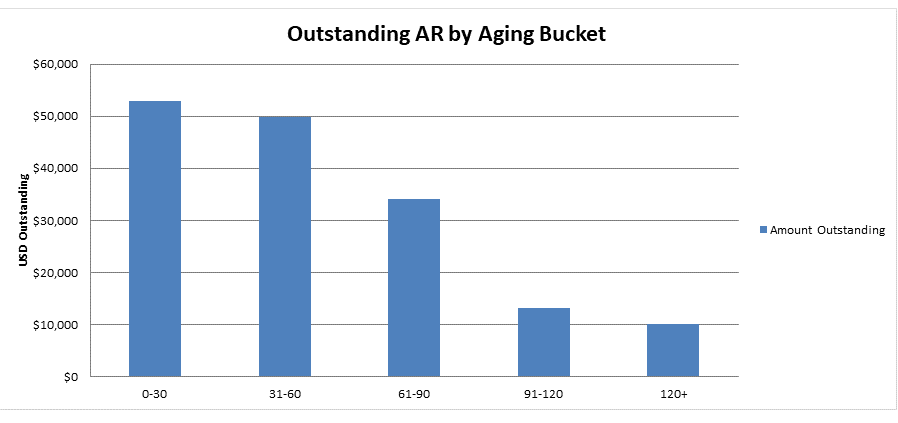
- $160K total AR is front-loaded: 64% (~$103K) sits in the fresh 0–60 day buckets, tapering steadily as age increases.
- Only 14.5% (~$23K) is past 90 days — the real follow-up priority, not the bulk of the balance.
- Shape overall is healthy: a clean downward slope, not a pile-up in the oldest bucket.
AR Aging Breakdown by Origin Month (which month’s claims are stuck where) |
|||||
| Origin Month | 0-30 | 31-60 | 61-90 | 91-120 | 120+ |
| Jan | $0 | $0 | $0 | $0 | $3,186 |
| Feb | $0 | $0 | $0 | $0 | $3,224 |
| Mar | $0 | $0 | $0 | $2,985 | $3,610 |
| Apr | $0 | $0 | $7,981 | $10,200 | $0 |
| May | $0 | $13,490 | $26,198 | $0 | $0 |
| Jun | $24,370 | $36,410 | $0 | $0 | $0 |
| Jul* | $28,520 | $0 | $0 | $0 | $0 |

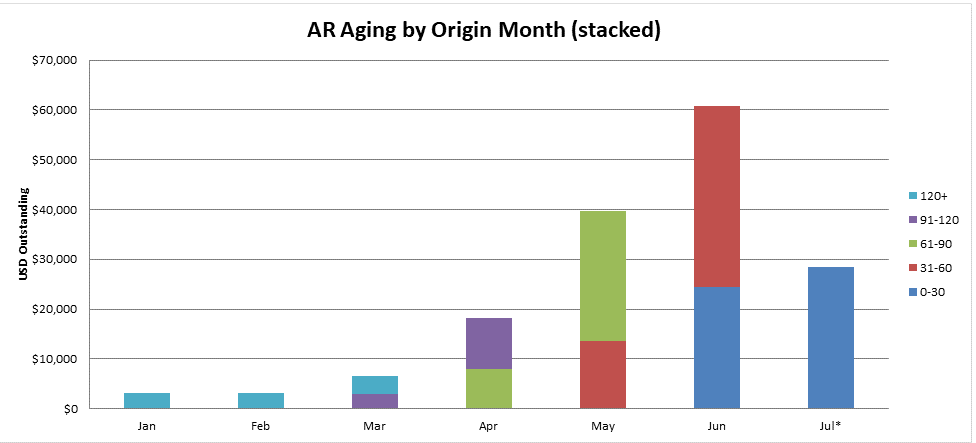
- Each bar’s color shows its claims are aging exactly on schedule — Jan/Feb claims are now 120+ days old, June’s are still fresh (0–30), a clean diagonal pattern with no claim “stuck” out of sequence.
- June ($61K) and July ($28K) carry the largest outstanding balances simply because they’re the newest that’s expected, not a warning sign.
- The real flag is small but real: Mar’s $2,985 sitting in 91–120 and Jan/Feb’s ~$6,400 combined in 120+ those are old enough that they should have resolved and are worth a follow-up push.
Insurance Payer Mix — Jan–Jul 202x |
|||||||||
Gross charges billed by payer, per month and overall (H1 total) |
|||||||||
| Gross Charges Billed by Payer, by Month | |||||||||
| Payer | Jan | Feb | Mar | Apr | May | Jun | Jul* | H1 Total | % of Total |
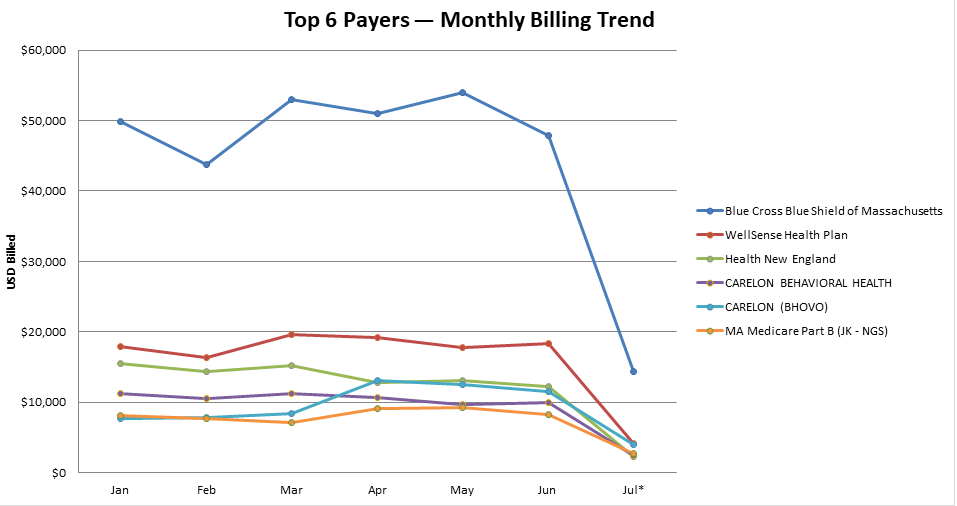
| Blue Cross Blue Shield of Massachusetts | $49,835 | $43,730 | $52,990 | $50,990 | $53,950 | $47,885 | $14,300 | $313,680 | 39.5% |
| WellSense Health Plan | $17,910 | $16,360 | $19,660 | $19,160 | $17,810 | $18,290 | $4,060 | $113,250 | 14.3% |
| Health New England | $15,425 | $14,280 | $15,250 | $12,825 | $13,060 | $12,235 | $2,275 | $85,350 | 10.7% |
| CARELON BEHAVIORAL HEALTH | $11,157 | $10,542 | $11,221 | $10,698 | $9,610 | $9,982 | $2,440 | $65,649 | 8.3% |
| CARELON (BHOVO) | $7,605 | $7,780 | $8,347 | $13,100 | $12,550 | $11,530 | $4,025 | $64,937 | 8.2% |
| MA Medicare Part B (JK – NGS) | $8,055 | $7,670 | $7,120 | $9,090 | $9,225 | $8,295 | $2,655 | $52,110 | 6.6% |
| Tufts Health Plan ACO | $5,540 | $5,775 | $6,115 | $5,830 | $5,755 | $7,155 | $2,175 | $38,345 | 4.8% |
| Harvard Pilgrim Health Care | $2,625 | $2,600 | $3,325 | $2,275 | $1,925 | $2,925 | $700 | $16,375 | 2.1% |
| Wellpoint | $2,625 | $2,100 | $1,750 | $1,280 | $1,650 | $2,175 | $700 | $12,280 | 1.5% |
| Value Options/MBHP (MA Behavioral Health Partnership) | $1,200 | $1,422 | $1,375 | $1,494 | $700 | $1,175 | $500 | $7,865 | 1.0% |
| UnitedHealthcare | $1,050 | $875 | $1,050 | $1,725 | $1,400 | $700 | $350 | $7,150 | 0.9% |
| Blue Benefit Administrators of MA | $700 | $525 | $875 | $875 | $700 | $875 | $0 | $4,550 | 0.6% |
| UNICARE | $875 | $875 | $525 | $700 | $875 | $525 | $175 | $4,550 | 0.6% |
| Aetna | $250 | $0 | $350 | $175 | $950 | $875 | $175 | $2,775 | 0.3% |
| ARCHDIOCESE OF BOSTON, INC | $0 | $0 | $0 | $525 | $525 | $1,050 | $175 | $2,275 | 0.3% |
| CT BCBS | $350 | $350 | $350 | $350 | $350 | $175 | $0 | $1,925 | 0.2% |
| CIGNA | $350 | $175 | $350 | $175 | $0 | $175 | $0 | $1,225 | 0.2% |
| Fallon Community Health Plan | $0 | $0 | $0 | $175 | $0 | $0 | $0 | $175 | 0.0% |
| Total | $125,552 | $115,059 | $130,653 | $131,442 | $131,035 | $126,022 | $34,705 | $794,467 | $1 |

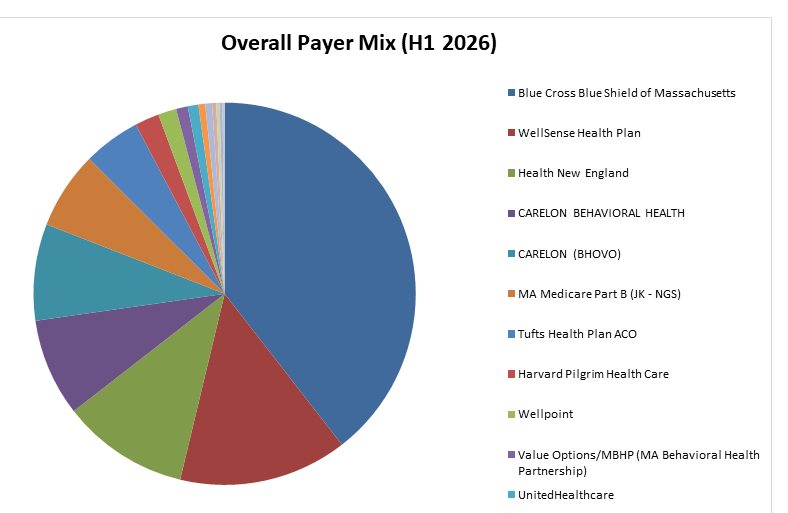
- Blue Cross Blue Shield of Massachusetts dominates at ~39.5% of insurance billing — nearly 2.5x the next-largest payer, which is real concentration risk if that relationship ever changes.
- The top 3 payers (BCBS MA, WellSense, Health New England) make up ~65% of the total; the remaining 15 payers split the other third.
- Long tail of small payers (Aetna, Cigna, Fallon, etc.) each contribute under 1% — not worth heavy operational focus, but useful to keep on file for occasional referrals.


| Want to see this for your own practice?
Send us six months of your billing exports TherapyNotes, SimplePractice, or your EHR’s equivalent and we’ll hand back a report like this one: full data, real charts, no names redacted (that part’s just for the public sample). |